Circular progress bar in Axure
Data visualization is a more and more important part of UX projects nowadays, and an aspect of UX that I am really fond [...]
Axure 8 has recently been released as a Beta version for first testings. Reading the release note, a few improvements caught my eye, like the rotate action, the possibility to draw your own shapes, apply interactions on groups and set boundaries when moving widgets around. I have been working a lot on dashboards and data visualization lately, and I decided to try the new Axure 8 in the objective of creating an animated dashboard composed of data visualization widgets that I could re-use in later wireframing projects.
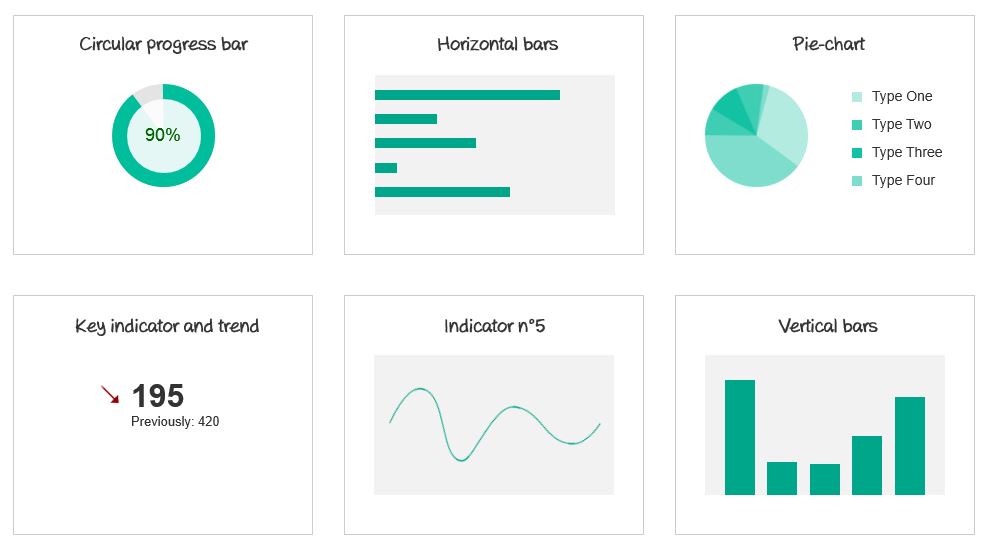
As a result, the *.rp file includes a dashboard with different data visualization widgets, easily re-usable for any project. This prototype includes a circular progress bar (much better than the previous circular progress bar I could design), horizontal and vertical bars charts and a pie-chart. I also added to this demo dashboard a key indicator with trend (comparison to previous period) and a simple curve, easy to design on Axure now.
View the HTML prototype demo on Axshare or download Axure source
In the process of wireframing these widgets, I tried new features of Axure 8. If at first sight the Mac-like header was a disappointment, this would be the only one. I found evolutions are mostly positive, and bring interaction to an even higher (and even funnier) level.
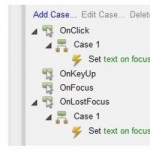
The idea of wireframing this dashboard is to be able to re-use widgets in any project. They are designed as masters, so very easy to drag and drop to any interface. To change colors or size, you might have to open the masters themselves, and make the relevant changes.

Data visualization is a more and more important part of UX projects nowadays, and an aspect of UX that I am really fond [...]
Simple text fields are a basic widget in Axure library, and one often needed. Instead of just dropping a text field on [...]
In a previous article on the blog, we have seen how to prototype a fixed-positioned menu in Axure. I realized this was [...]