Fixed position menu in Axure
Fixed-position menus are often used on websites or applications today. They allow the menu (or any other toolbar) to [...]
If you know Axure (a powerful wireframing and prototyping tool), you are probably familiar with Axure Cloud, their Cloud publishing platform. That’s where a designer can upload their work to make it visible at a given URL to clients and teams. Among other benefits (like comments), it offers the possibility to add plugins to your prototype, and this feature can be pretty powerful. Today I want to focus on how to use the plugins to connect an interactive prototype to Google Analytics and Hotjar, and get feedbacks on users’ behaviors with your interface.
Google Analytics and Hotjar are two tracking systems that live-monitor the behavior of users on a web page or app. It will know when users click, scroll, mouse over, complete tasks or exit a page, and show this to you in a dashboard.
Most of the time, these are used on published websites or mobile applications, helping product teams identify pain points and optimizations.
There is a also great value in being able to get that observation feedbacks before publishing a product. Doing so on a prototype is even better, as it allows to collect behaviorial data from users browsing freely on a digital product and helps identify pain-points and optimizations before pushing it to the market.
There is great value to observing how users interact with your prototype early on, to valide hypothesis and identify pain-points and optimizations.
So, how can we connect Google Analytics and Hotjar to a prototype published on Axshare? Very simply, thanks to the plugin feature on Axshare, and here is how:
Note that the page titles are inherited directly from your prototype. So make sure they are meaningful. A little hint: I add a letter code before similar pages (like start all product lists pages with « pl_ ») so I can then easily group these pages in the GA tracking.
Also, GA will track pages, so best not to build your prototype with only one page and multiple dynamic panels!
Basically, we are going to create a new Property in GA, and then add the Global Site Tag in the header of our prototype pages via the Plugin feature in Axure Cloud.
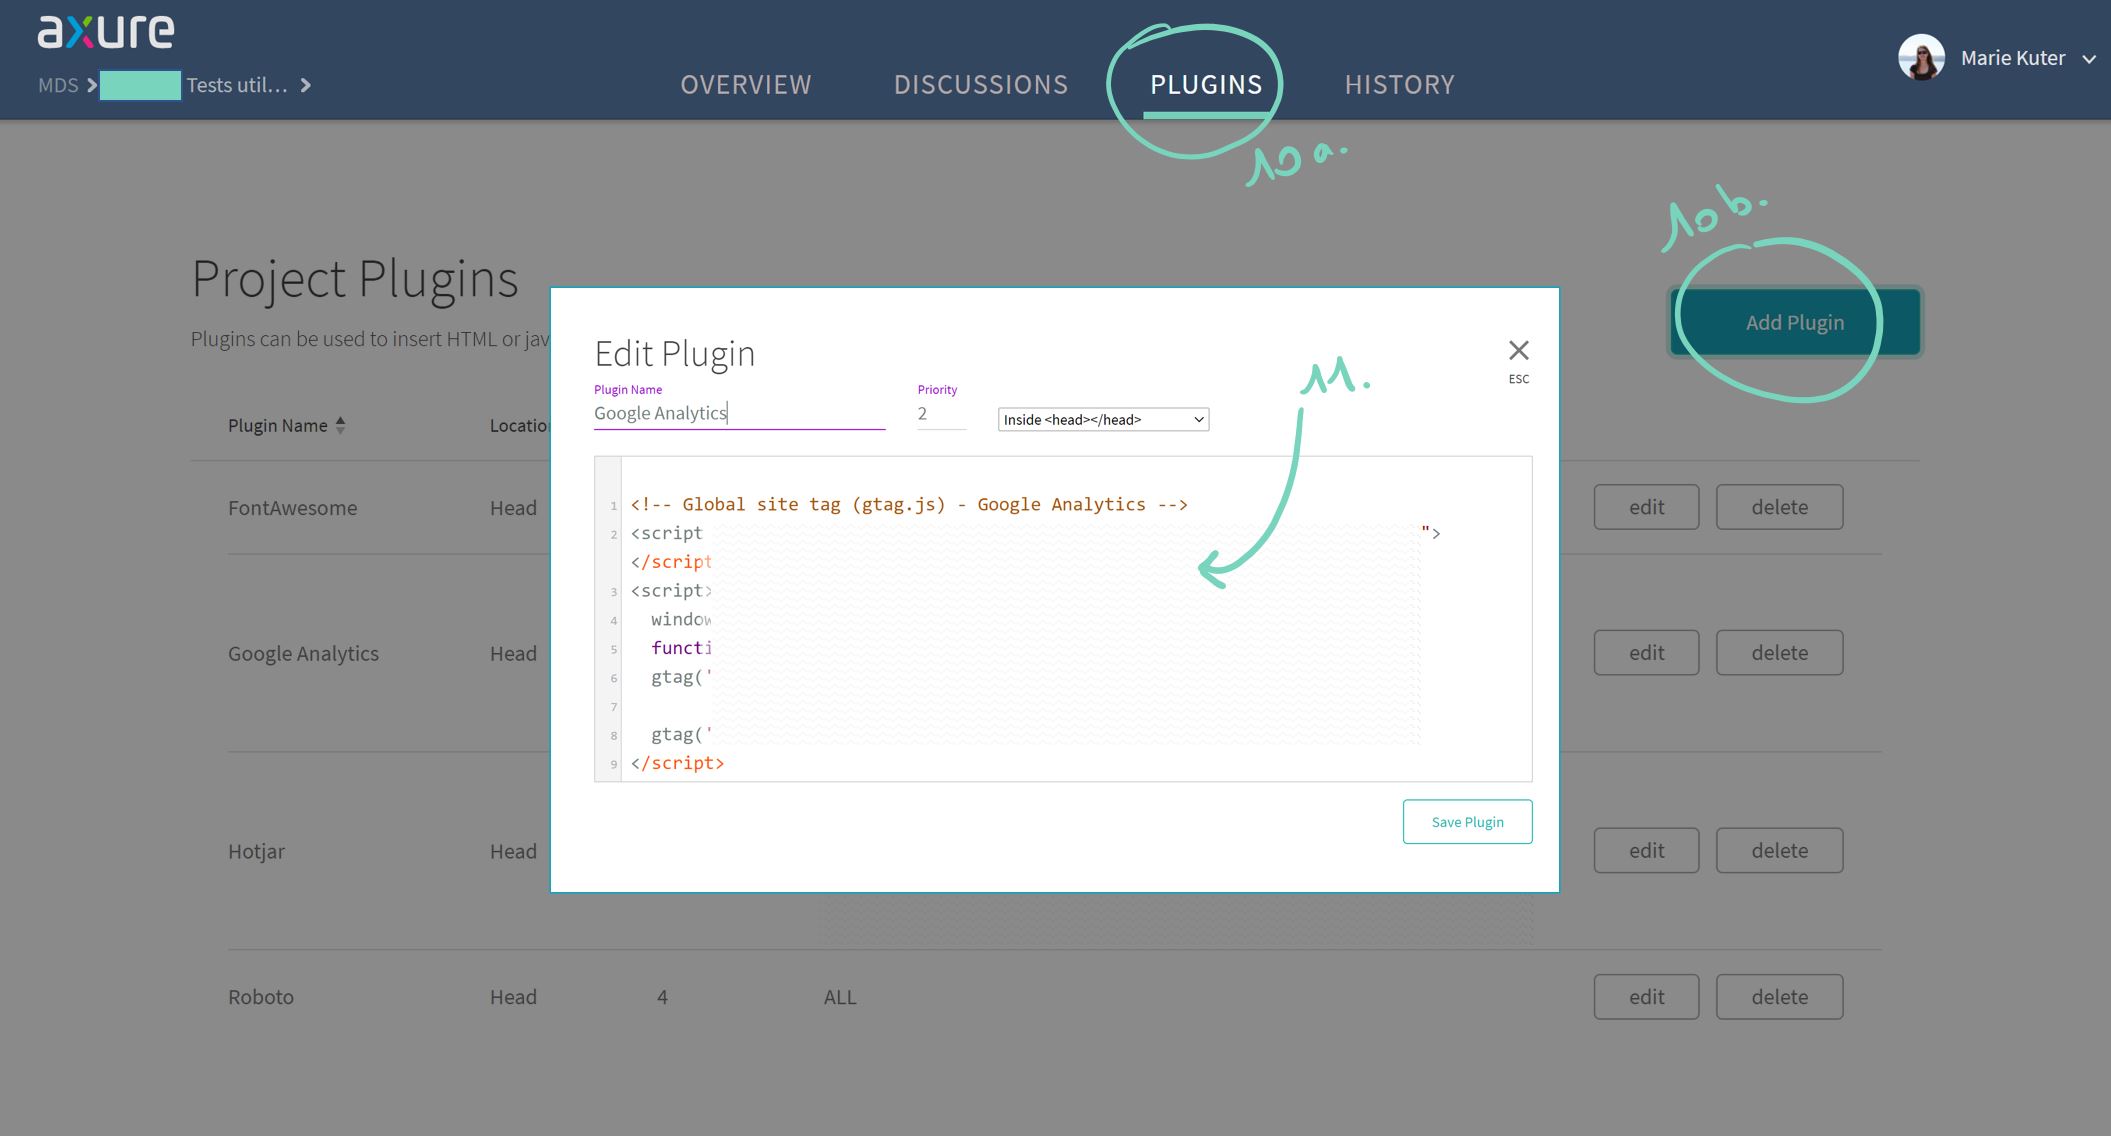
You are all set! Now your GA property is tracking activity on your Axure Cloud prototype. Give it a few minutes, and try it yourself, to see how it works.
We are going to follow exactly the same principle for Hotjar.
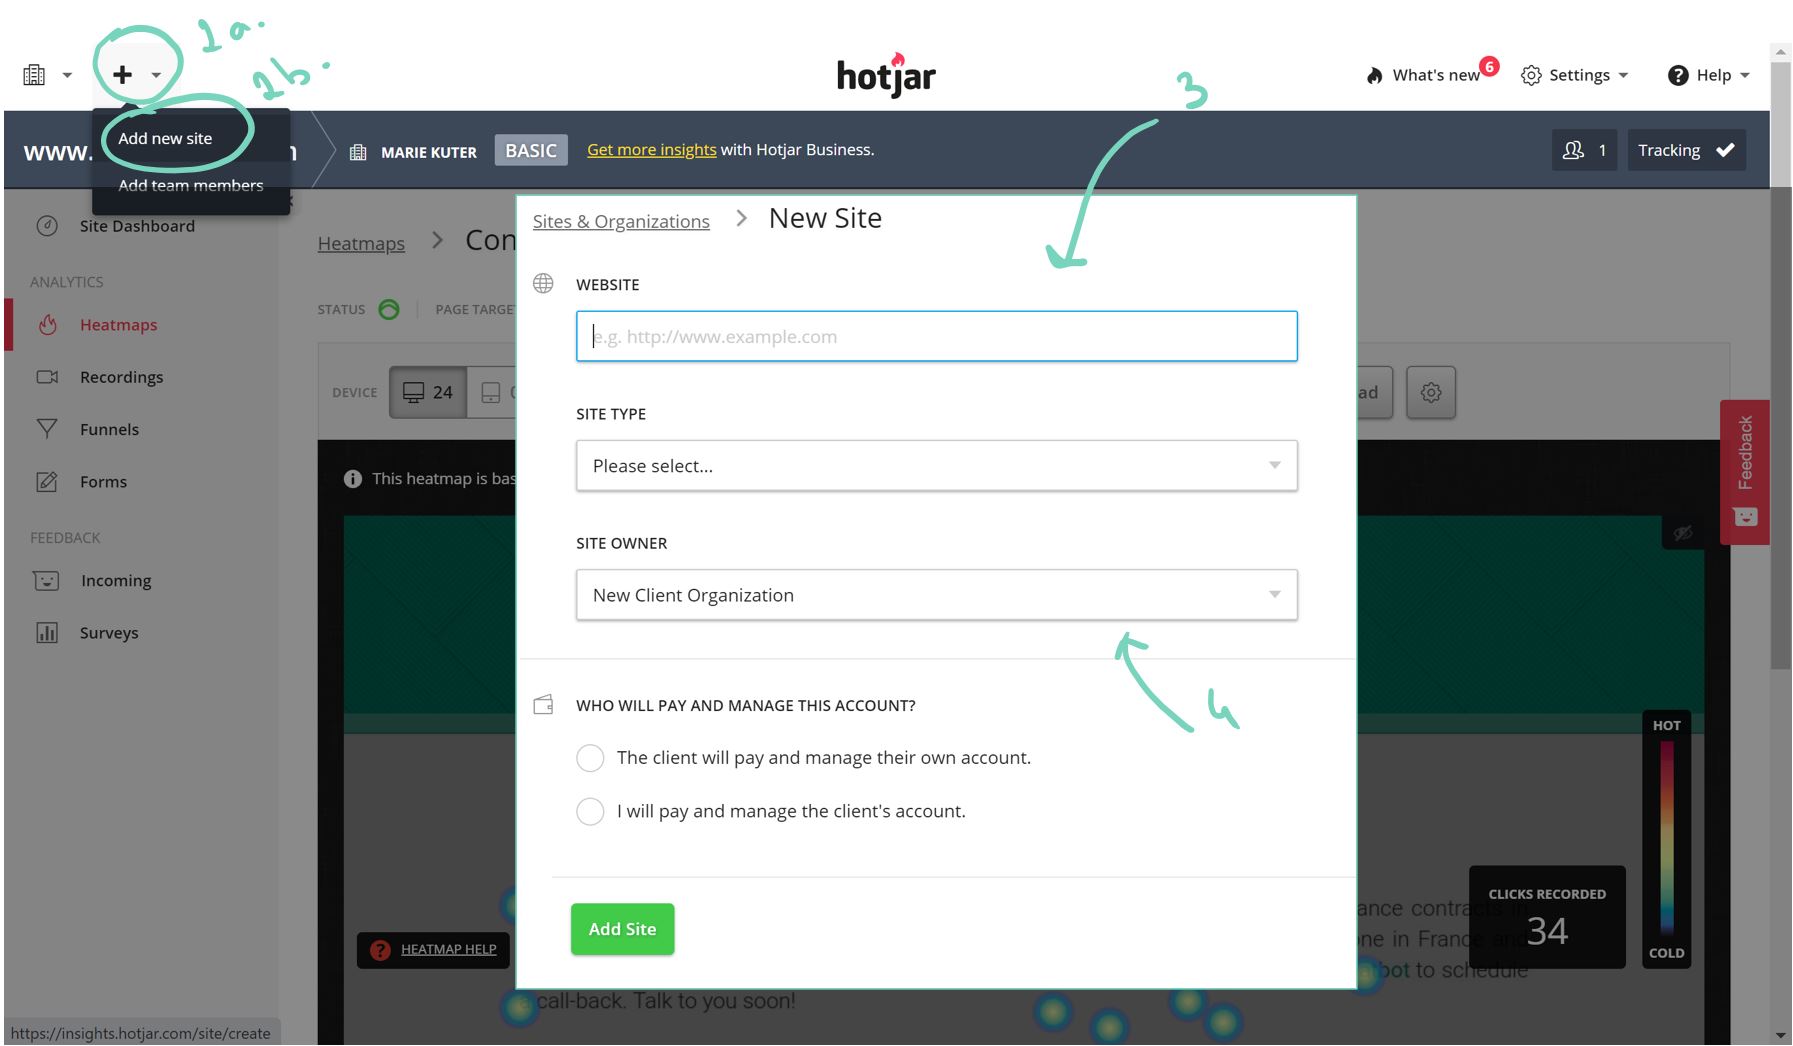
All ready! Now you can go back to your Hotjar account to verify the installation, and create Funnels, Heatmaps, Recordings, etc. (don’t forget to do so, otherwise the tracking will work, but it won’t know what to monitor.)
These few steps took a little of your time, but now you can observe your users how they browse through your screens. Google Analytics will show you most visited screens and how long users spend on them. Hotjar will tell you to what point they scroll to, and where they click. It will allow you to replay session recordings and note pain-points. You can even propose a survey to ask questions contextually to the screens people are watching!
Actually, possibilities here are unlimited, and you could very well go much further by plugging in a Google Tag Manager. In my experience, this combination of tools was plenty enough for the kind of insights we were looking for at the prototyping stage (in complement to user testings as well.)
I will try to publish a related article to share feedbacks on a recent similar implementation I worked on with one of my clients. Stay tuned and talk soon!

Fixed-position menus are often used on websites or applications today. They allow the menu (or any other toolbar) to [...]
Simple text fields are a basic widget in Axure library, and one often needed. Instead of just dropping a text field on [...]

In a previous article on the blog, we have seen how to prototype a fixed-positioned menu in Axure. I realized this was [...]