Google Consumer Barometer and UX

Published on the 6 août 2015

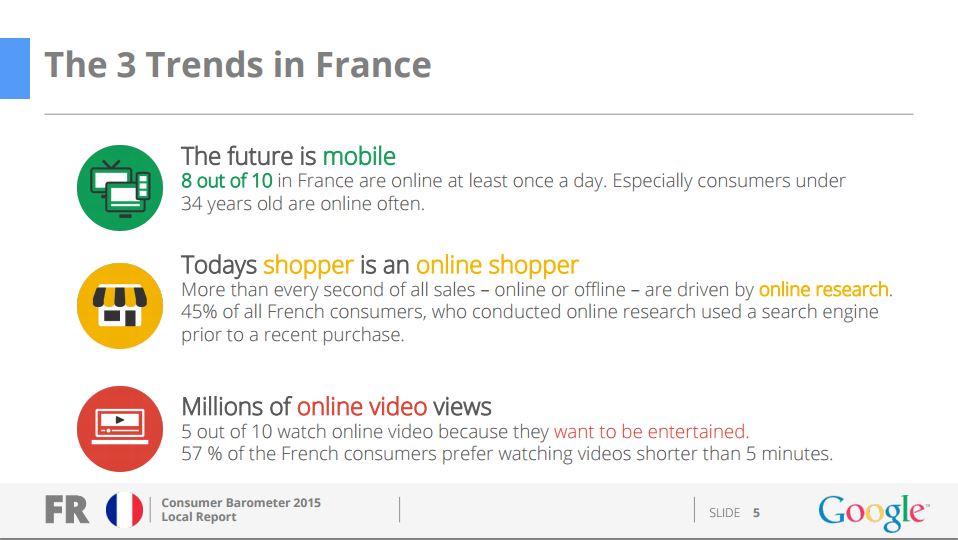
Started 4 years ago, Google Consumer Barometer is an free Web application offering consumer insights. Based on data collected by TNS through surveys in 50 countries, the tool presents main conclusions regarding consumption, online or locally, in different domains. A few conclusions are especially interesting for UX design, including the link between digital and physical stores, or how Internet is used in the buying process.

Main conclusions (for France in my example), are available in a PDF document, with nice data visualization. Another interesting aspect of this tool is that it lets you build your own graphs, based on the available data, through the Graph builder tab (top right.)

Key conclusions

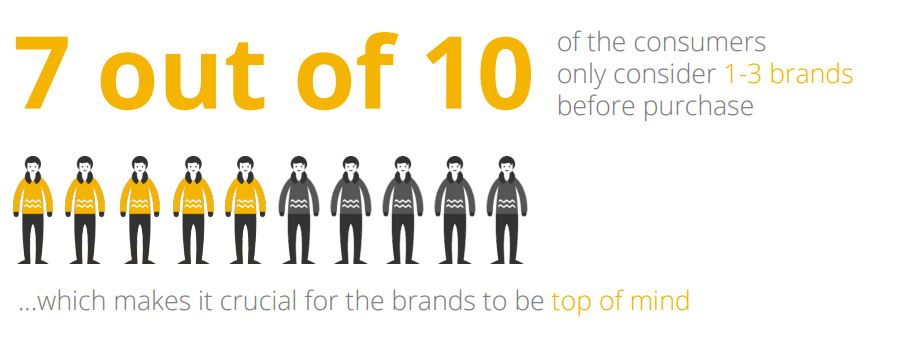
Among main conclusions, here are a few key facts and figures I want to keep in mind: consumers…

  1. are connected: 8 out of 10 consumers are online at least once a day.
  2. use search engines: 45% consumers use a search engine to get informed before making a purchase and 47% consumers use search engines on their smartphone at least once a week.
  3. limit their search: 7 out of 10 consumers only consider 1 to 3 brands before purchase!
  4. have a smartphone: 91% consumers use a smartphone, whereas only 74% use a computer, and 93% use a TV.
  5. but use their computer to research: 75% consumers only used their computer to research their purchase.
  6. use their smartphone to: take photos or videos (58%), tell time (56%) and set alarm clock (53%.)
  7. use Internet to: compare products (46%), and 28% to look for opinions (28%.)
  8. are users, not admin: only 23% consumers often post content online, when 83% go to Internet first when they need information.

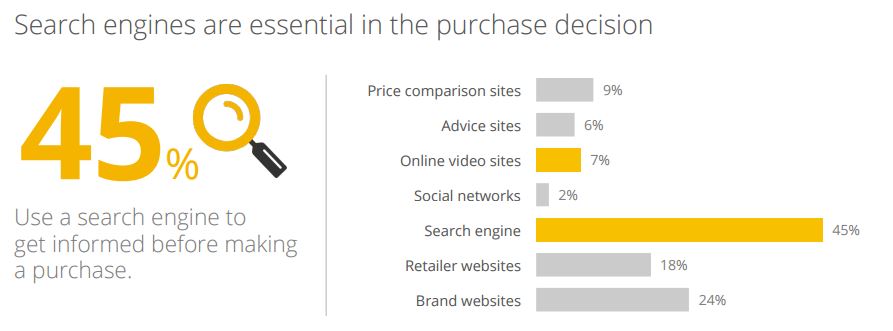
Among other conclusions, I noted that search engines are the most quoted (45%) online source people use to make a purchase decision. In 60% cases, search engines are even the first point of contact with the purchased product.

When purchasing products online from foreign countries, main issue quoted by consumers is that the website seemed insecure.

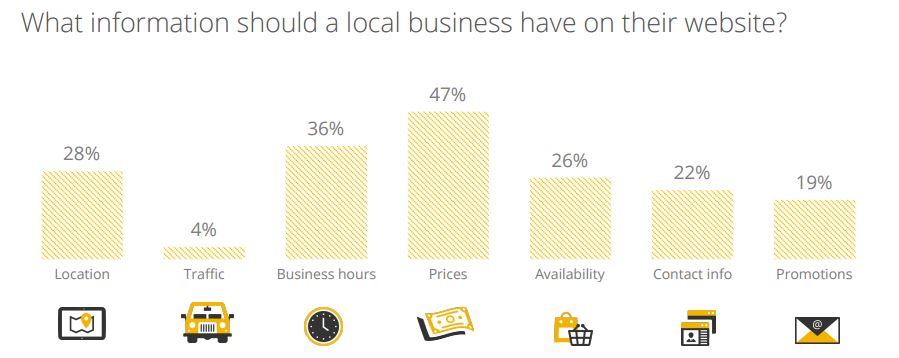
When looking for a local business, consumers quote Prices, Business hours and Location as the most important information.

info-local-business-website


search-engines-purchase-decision

Impacts on UX

Once we know all of that, what can we, as UX designers, do better with this insight?

  1. This data shows that the experience is more and more important, and starts long before the user’s visit to a boutique or a website. Brand has to be among the 1 – 3 ones the consumer will consider before purchase. Search Engine Optimization, communication, content is as crucial as ever.
  2. This is no news, consumers spend more and more time on their smartphones. This data shows that a lot of them use search engines on their mobiles. As UX, we need to make sure what the landing pages look like on a mobile, once the user has found us and clicked on a link in Google.
  3. It might sound easy, but all Websites should display prices, business hours and location right away, and make sure this information is not hidden. And don’t forget your Home is not necessarily the first landing page! How about adding this information on all product pages, as we have just learned that users might come from search engine? Products landing pages are often optimized for e-commerce purchase, but main information to physical point of sales should not be forgotten, especially in a mobility context.
  4. Consumers quote feeling of insecurity as the main issue when purchasing from a foreign website. UX can greatly help with making users feel secure, and reassuring elements, such as payment methods, shipping prices and alternatives, hotline or contact means, etc. remain a must-have.
  5. Consumers are more and more familiar with Internet and their smartphones, but still as users: not many of them (23%) are on the admin side for publishing content. We can’t assume users are familiar with code or anything backend: the front still has to be user-friendly, and error messages understandable by all.

To learn more, read the Google Consumer Barometer Country report for France (PDF) or make your own graphs on the Consumer Barometer Web app

Tags :