Blog: Trends and insights
Data visualization: tables, graphs and augmented tables

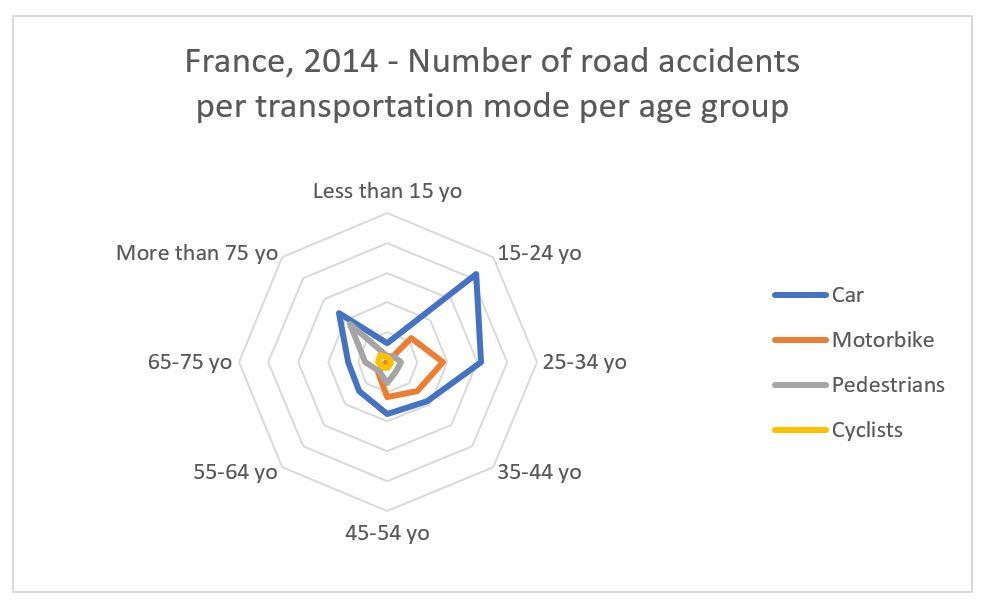
One of my clients recently came to me with a big table of raw data. He was a bit challenged by the fact that all the right data was properly collected and presented in this table, though users did not seem to be able to read the data. Even more challenging was the fact that the data actually came from them initially, but they had trouble even understanding the table itself, let alone make the decisions it was supposed to help them with. What was the problem there? When it comes to data visualization, tables are more often than not underestimated, to the benefit of good-looking graphs. But the choice between tables and graphs is not always that automatic.
e-commerce: 8 product visual trends to improve customer experience

Applying best practices and standards is not sufficient for e-commerce any longer. Successful websites have to focus on customer experience throughout the whole process, and offer the best possible service. In this era governed by pictures, with stars like Instagram or Youtube, product visual is getting more and more important for e-shoppers. If a thumbnail can potentially still be sufficient for everyday groceries, the power of a high-quality, detailed and in-situation picture has never been stronger. And technology can support working harder and going further on product visuals, including 360° view, cinemagraph and augmented reality.
Luxury e-commerce in 2017: A user experience index

Did you know online sales represented 6% of the global luxury market for personal goods in 2014? Luxury e-commerce has grown in the past years, by 27% between 2009 and 2014. Selling on the Internet is a big challenge for renowned luxury maisons, and one big strategic step, that more and more of them are taking.
At the same time, technology is constantly developing, and innovations like product image recognition, chatbots, machine learning and cinemagraph represent as many opportunities to create a unique, delightful experience on luxury brands e-commerce websites.
Machine learning: myths and reality with IBM Watson

Have you met Watson? He is IBM supercomputer, combining artificial intelligence and sophisticated analytical software that allows it to analyze lots of data and make complex decisions and predictions. Machine learning is everywhere nowadays, and just as any buzzword, its use far outreaches its true meaning. During Crea first innovation meetup in Geneva last week, François Rodriguez, from Crea, and IMB Jérôme de Nomazy introduced me to Watson, and at the same occasion helped extract the truth from the myth.
Xenia Tchoumi women and digital talk at the UN

Famous fashion influencer and social media personality, Xenia Tchoumi gave an inspirational speech today at the United Nations in Geneva. A few hours before the International Women’s Day, the well-known blogger made light on how social media and technology can empower women and businesses accross the world. She gave a few tips about social media content publishing, and answered questions received live on the International Trade Center Facebook page, where the event was broadcasted live.
French e-commerce conversion barometer 2016

Capitaine Commerce has recently published their French e-commerce conversion barometer for 2016. More than 400 e-merchants answered to their survey about conversion metrics. Among other interesting conclusions, the report highlights the average conversion rates by sector (ratio between the number of transactions and the number of unique visitors.) The average conversion rate for all domains is 3%, with great differences between industries.